📋 다이어그램 예제
📊 플로우차트 (Flowchart)
사용자 로그인 프로세스를 플로우차트로 표현하는 예제입니다.
# Claude에게 요청:
"로그인 프로세스 플로우차트를 그려줘.
1. 시작 → 로그인 페이지
2. 아이디/비밀번호 입력
3. 인증 확인 (판단)
4. 성공 시 → 대시보드
5. 실패 시 → 에러 메시지 → 로그인 페이지로 돌아감"
# 실제 도구 호출 (JSON):
# steps: type은 start, end, process, decision, data, document 중 선택
# next: 다음 단계의 label을 배열로 지정 (decision은 여러 개 가능)
{
"name": "create_flowchart",
"arguments": {
"steps": [
{"type": "start", "label": "시작", "next": ["로그인 페이지"]},
{"type": "process", "label": "로그인 페이지", "next": ["입력"]},
{"type": "data", "label": "입력", "next": ["인증 확인"]},
{"type": "decision", "label": "인증 확인", "next": ["대시보드", "에러"]},
{"type": "process", "label": "대시보드", "next": ["종료"]},
{"type": "document", "label": "에러", "next": ["로그인 페이지"]},
{"type": "end", "label": "종료"}
],
"format": "png"
}
}
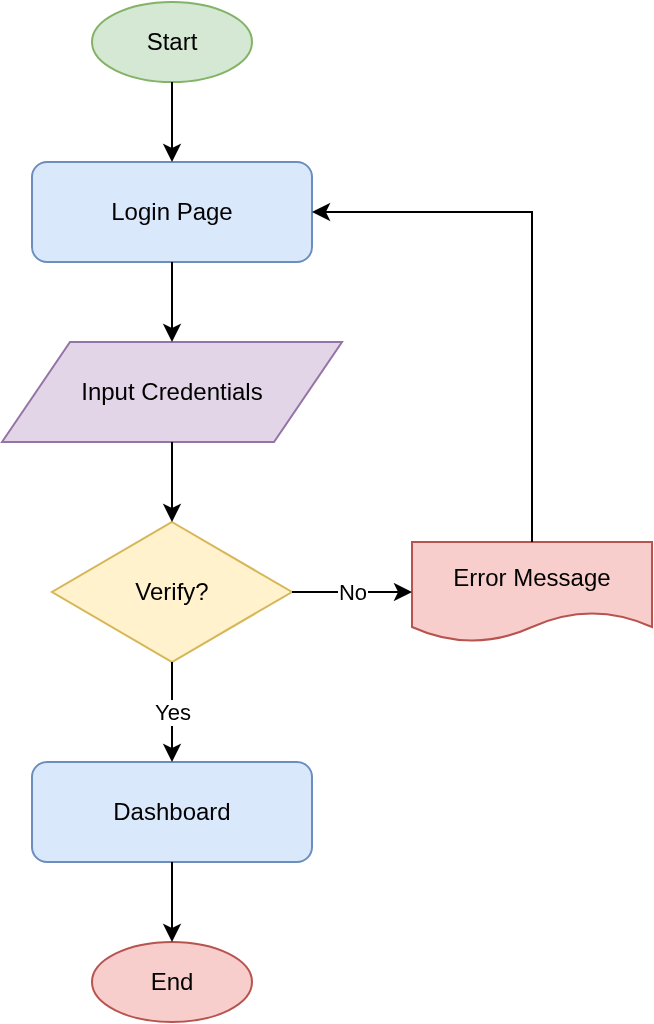
실제 생성된 플로우차트 다이어그램
🗄️ ERD (Entity-Relationship Diagram)
사용자-주문-상품 관계를 ERD로 표현하는 예제입니다.
# Claude에게 요청:
"쇼핑몰 ERD를 그려줘. 사용자, 주문, 상품, 주문상세 테이블 포함."
# 실제 도구 호출 (JSON):
# tables: 테이블 목록, columns에 pk/fk 지정 가능
# relationships: type은 "1:1", "1:N", "N:M" 중 선택
{
"name": "create_erd",
"arguments": {
"tables": [
{
"name": "users",
"columns": [
{"name": "id", "type": "INT", "pk": true},
{"name": "name", "type": "VARCHAR(100)"},
{"name": "email", "type": "VARCHAR(255)"}
]
},
{
"name": "orders",
"columns": [
{"name": "id", "type": "INT", "pk": true},
{"name": "user_id", "type": "INT", "fk": "users.id"},
{"name": "total_amount", "type": "DECIMAL(10,2)"},
{"name": "status", "type": "VARCHAR(20)"}
]
},
{
"name": "products",
"columns": [
{"name": "id", "type": "INT", "pk": true},
{"name": "name", "type": "VARCHAR(200)"},
{"name": "price", "type": "DECIMAL(10,2)"}
]
},
{
"name": "order_items",
"columns": [
{"name": "id", "type": "INT", "pk": true},
{"name": "order_id", "type": "INT", "fk": "orders.id"},
{"name": "product_id", "type": "INT", "fk": "products.id"},
{"name": "quantity", "type": "INT"}
]
}
],
"relationships": [
{"from": "orders", "to": "users", "type": "1:N"},
{"from": "order_items", "to": "orders", "type": "1:N"},
{"from": "order_items", "to": "products", "type": "1:N"}
],
"format": "png"
}
}
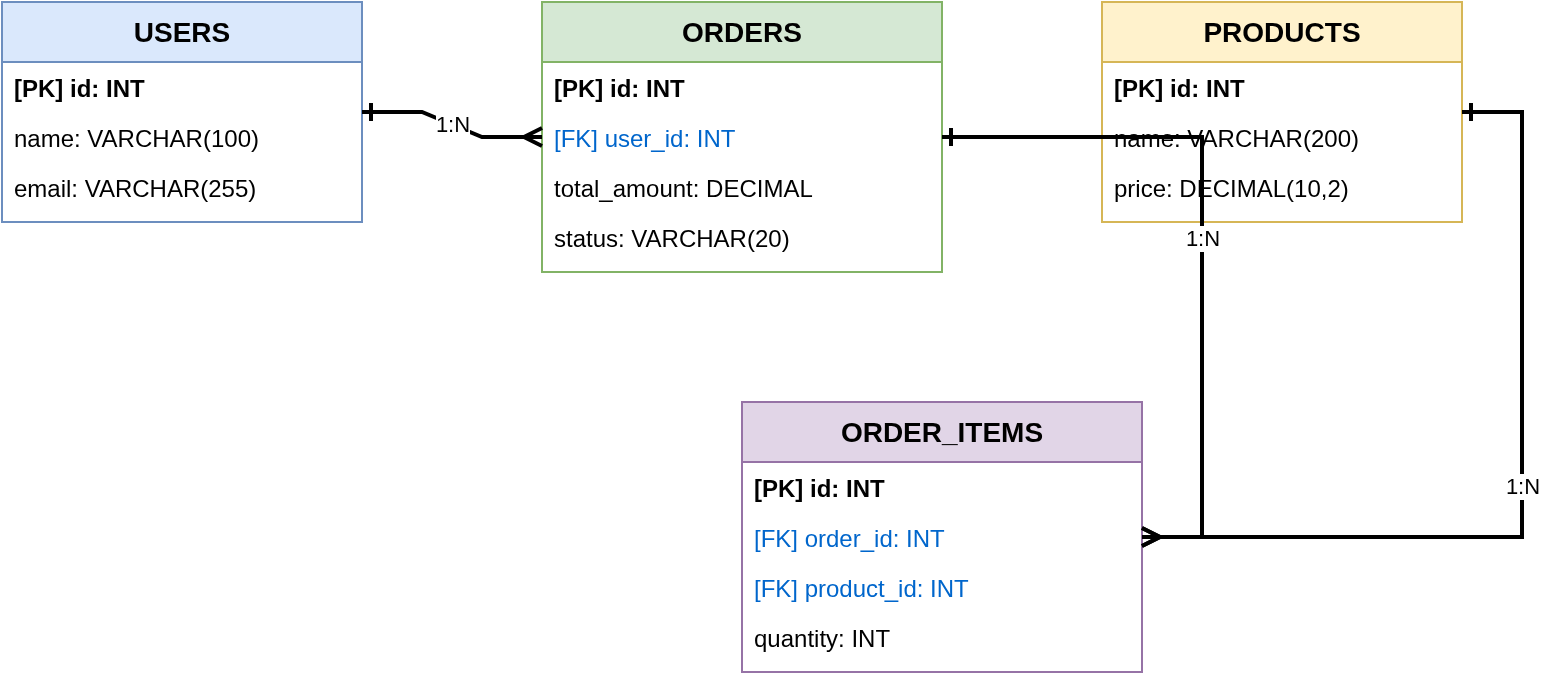
실제 생성된 ERD 다이어그램
🔄 시퀀스 다이어그램 (Sequence Diagram)
API 인증 흐름을 시퀀스 다이어그램으로 표현하는 예제입니다.
# Claude에게 요청:
"OAuth2 인증 흐름 시퀀스 다이어그램을 그려줘."
# 실제 도구 호출 (JSON):
# actors: 참여자 이름 배열
# messages: from/to는 actors의 인덱스(0부터), type은 call 또는 return
{
"name": "create_sequence_diagram",
"arguments": {
"actors": ["Client App", "Auth Server", "API Server"],
"messages": [
{"from": 0, "to": 1, "label": "1. 인증 요청"},
{"from": 1, "to": 0, "label": "2. 로그인 페이지", "type": "return"},
{"from": 0, "to": 1, "label": "3. 자격증명 전송"},
{"from": 1, "to": 0, "label": "4. Access Token", "type": "return"},
{"from": 0, "to": 2, "label": "5. API 요청 (Bearer Token)"},
{"from": 2, "to": 1, "label": "6. Token 검증"},
{"from": 1, "to": 2, "label": "7. 검증 결과", "type": "return"},
{"from": 2, "to": 0, "label": "8. API 응답", "type": "return"}
],
"format": "png"
}
}
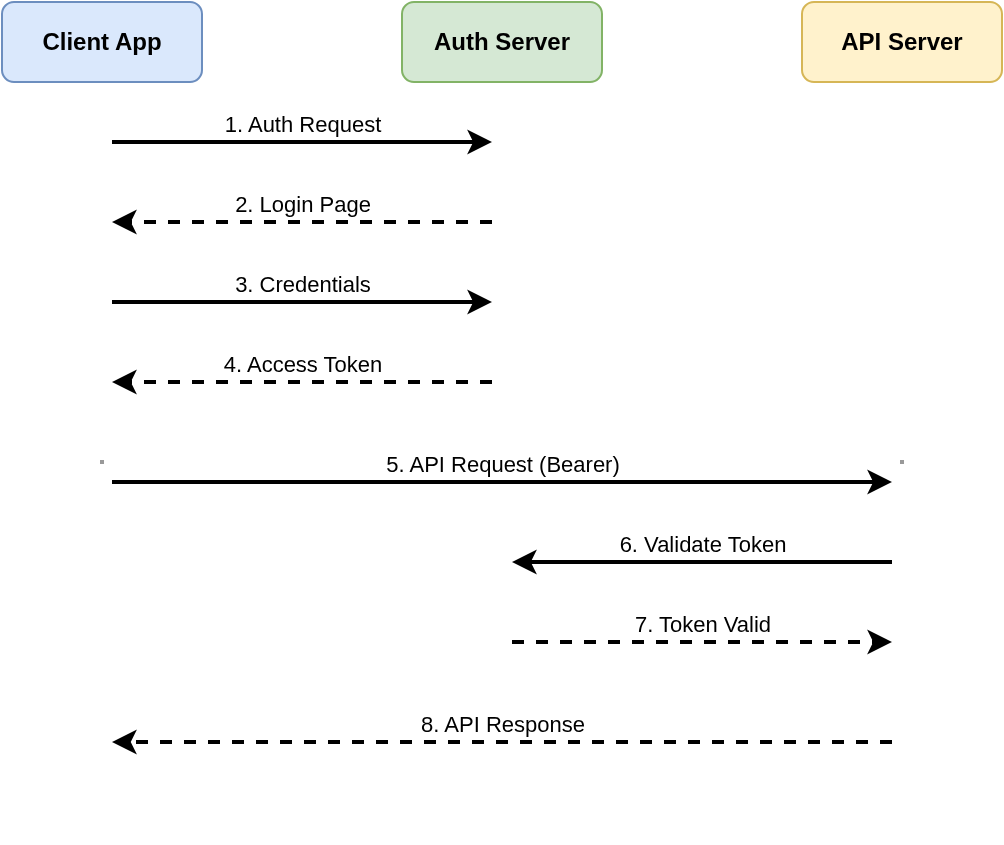
실제 생성된 시퀀스 다이어그램
☁️ 클라우드 아키텍처 (AWS)
AWS 3-tier 아키텍처를 커스텀 다이어그램으로 표현하는 예제입니다.
# Claude에게 요청:
"AWS 3-tier 웹 아키텍처 다이어그램을 그려줘.
ALB → EC2 (Auto Scaling) → RDS 구조로."
# 실제 도구 호출 (JSON):
# elements: type은 도형 이름, connects로 연결할 대상 label 지정
# x, y로 위치 지정 가능 (선택사항, 미지정시 자동 배치)
{
"name": "create_custom_diagram",
"arguments": {
"elements": [
{"type": "networkInternet", "label": "Internet", "x": 400, "y": 50, "connects": ["CloudFront"]},
{"type": "awsCloudFront", "label": "CloudFront", "x": 400, "y": 150, "color": "awsOrange", "connects": ["ALB"]},
{"type": "awsALB", "label": "ALB", "x": 400, "y": 250, "color": "awsOrange", "connects": ["EC2-1", "EC2-2"]},
{"type": "awsEC2", "label": "EC2-1", "x": 250, "y": 350, "color": "awsOrange", "connects": ["RDS", "S3"]},
{"type": "awsEC2", "label": "EC2-2", "x": 550, "y": 350, "color": "awsOrange", "connects": ["RDS", "S3"]},
{"type": "awsRDS", "label": "RDS", "x": 400, "y": 480, "color": "awsBlue"},
{"type": "awsS3", "label": "S3", "x": 650, "y": 350, "color": "green"}
],
"format": "png"
}
}
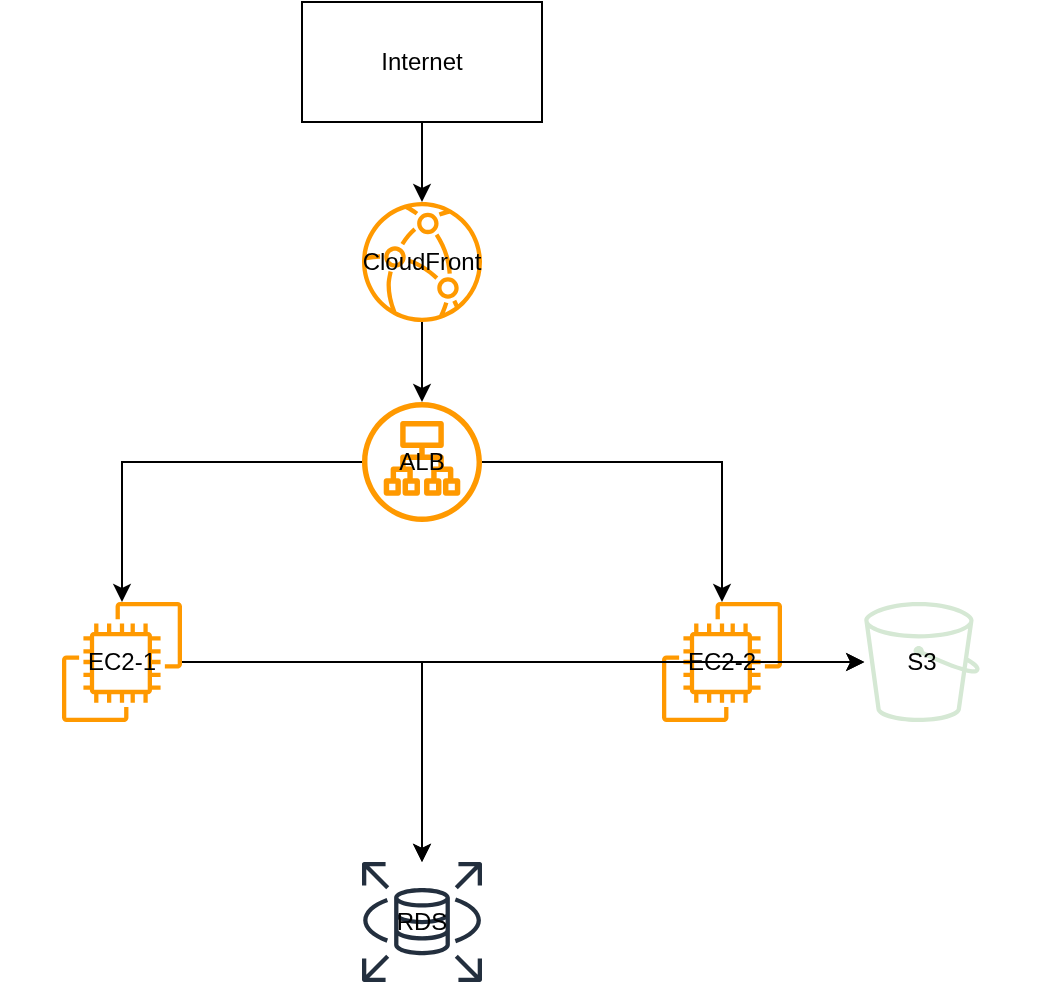
실제 생성된 AWS 아키텍처 다이어그램
🔧 Kubernetes 아키텍처
Kubernetes 클러스터 구조를 다이어그램으로 표현하는 예제입니다.
# Claude에게 요청:
"Kubernetes 마이크로서비스 배포 구조 다이어그램을 그려줘."
# 실제 도구 호출 (JSON):
# Kubernetes 도형: k8sPod, k8sDeployment, k8sService, k8sIngress 등
{
"name": "create_custom_diagram",
"arguments": {
"elements": [
{"type": "k8sIngress", "label": "Ingress", "x": 400, "y": 50, "color": "blue", "connects": ["API Service", "Web Service"]},
{"type": "k8sService", "label": "API Service", "x": 250, "y": 150, "color": "blue", "connects": ["API Deploy"]},
{"type": "k8sService", "label": "Web Service", "x": 550, "y": 150, "color": "blue", "connects": ["Web Deploy"]},
{"type": "k8sDeployment", "label": "API Deploy", "x": 250, "y": 250, "color": "green", "connects": ["API Pod 1", "API Pod 2"]},
{"type": "k8sDeployment", "label": "Web Deploy", "x": 550, "y": 250, "color": "green", "connects": ["Web Pod"]},
{"type": "k8sPod", "label": "API Pod 1", "x": 150, "y": 350, "connects": ["ConfigMap"]},
{"type": "k8sPod", "label": "API Pod 2", "x": 350, "y": 350, "connects": ["Secret"]},
{"type": "k8sPod", "label": "Web Pod", "x": 550, "y": 350, "connects": ["PVC"]},
{"type": "k8sConfigMap", "label": "ConfigMap", "x": 150, "y": 450, "color": "purple"},
{"type": "k8sSecret", "label": "Secret", "x": 350, "y": 450, "color": "red"},
{"type": "k8sPVC", "label": "PVC", "x": 550, "y": 450, "color": "orange"}
],
"format": "png"
}
}
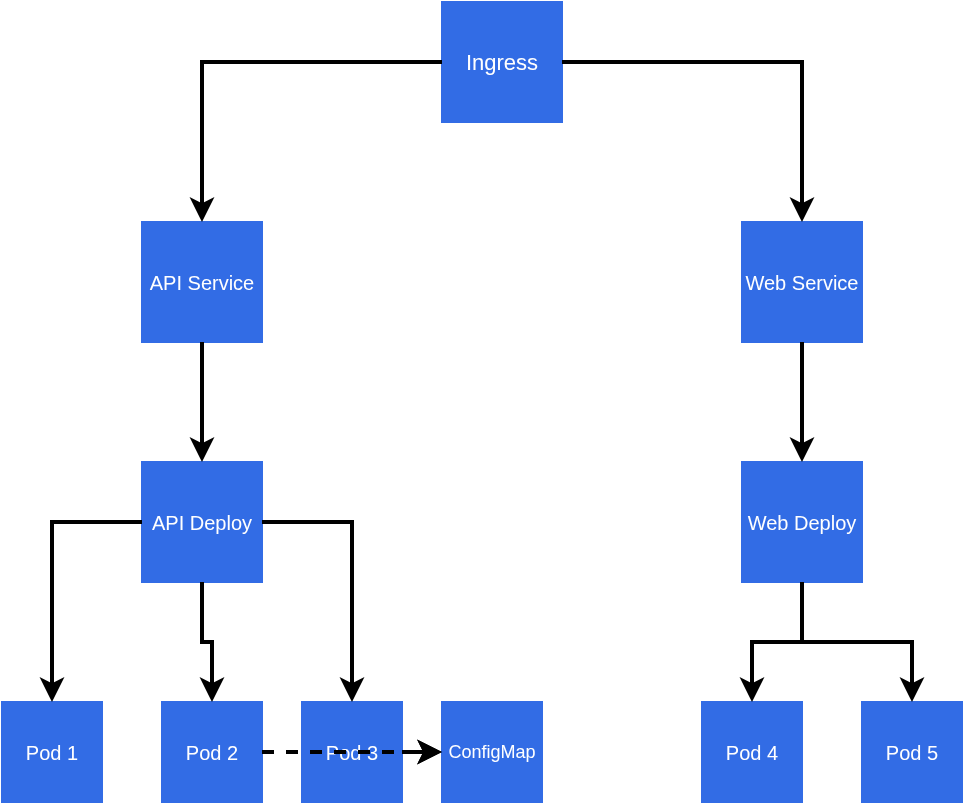
실제 생성된 Kubernetes 아키텍처 다이어그램